Big data is an important topic. That already shows a study by Bitkom . In 2018, the association surveyed over 600 companies on trending topics and found the following results:
- 57 percent are planning investments in big data or are already being implemented
- The five top topics are big data (57%), Industry 4.0 (39%), 3D printing (38%), robotics (36%) and VR (25%)
- But: New concepts and possibilities such as artificial intelligence and blockchain have only rarely been used so far
Reading tip: What is big data
Implementation of big data only hesitantly
According to the study, the potential of big data is only being used hesitantly. According to the study, the reasons for this are the requirements for data protection (63%) and the technical implementation (54%) as well as a lack of specialists (42%).
Reading tip: What is a data scientist
I am currently working on the technical implementation. In order to really use big data in a meaningful way, numerous technical requirements have to be created. I would like to give a practical example, which should serve as an impulse for practice.
Practical example: building a data lake
Due to my job, I am often involved in customer projects that want to set up big data architectures. In the following I made a kind of blueprint from the majority of the projects. I would like to introduce them to you today. To make the example clearer, I’ll write the whole thing as a case study.
initial situation
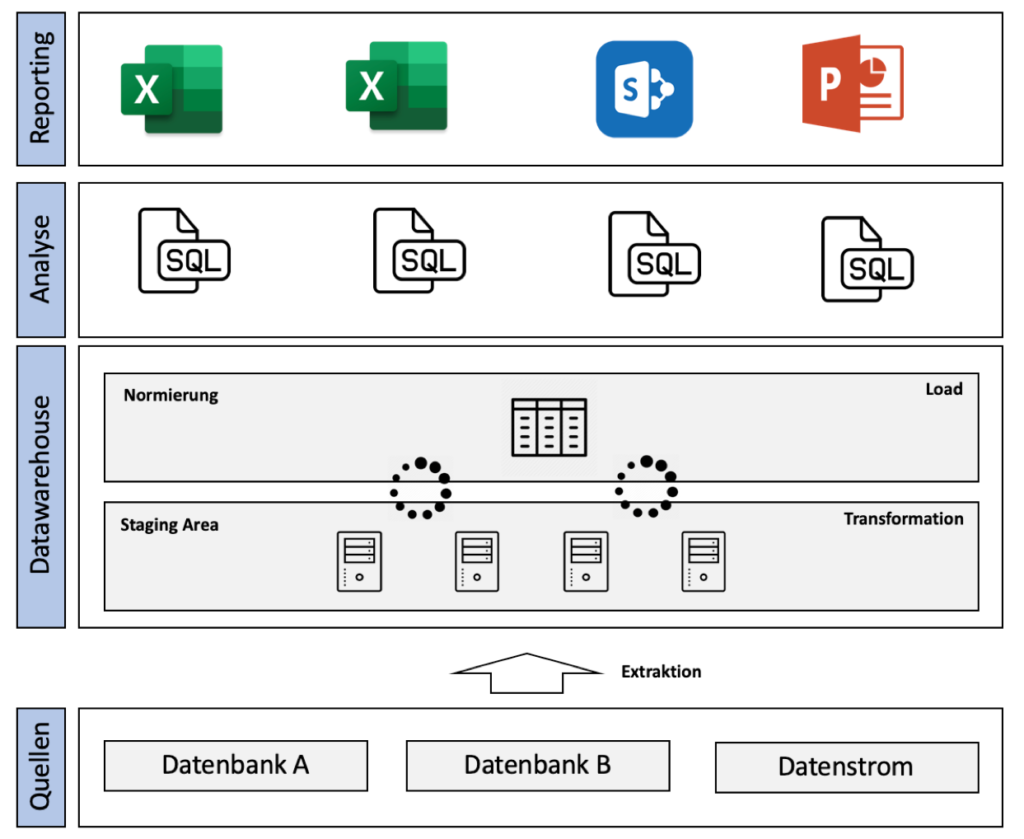
The customer is a fictitious large bank. Out different sources For example databases and data streams, the system copies data in raw form into a Staging area. A data stream is a continuous flow of data records, the end of which can usually not be foreseen in advance, e.g. transfers from a bank or payments to an account, as well as the heart rate monitor in the hospital or the temperature measurement of a weather station. Staging is used to ensure that the raw data is saved in its current form with a time stamp. The advantage is that these are still there in the event that the external data source is lost.
The staging area saves the data on different hard drives using a secure and redundant storage format. The data is converted into a uniform format in the Norming Area saved again. With the help of SQL queries data is exported in CSV format and saved in Sharepoint. Numerous external IT consultants use this to prepare weekly reports in PowerPoint and Excel. The reports are sorted in folders with the source data to be found on Sharepoint.

Summary of the architecture:
- Data comes from different source systems
- At the end of the day, the data is processed, standardized and recorded
- A wide variety of queries are made
- Reports are generated weekly by external service providers (MS Office and Sharepoint as storage location)
Now we come into play. The customer asked my team and me to design a new architecture. The reasons for this were:
- The reports require a lot of effort
- Little flexibility (especially AD-HOC requests)
- No versioned raw data
- High costs for external service providers
- Requirements regarding BCBS239 and MARISK can no longer be implemented (principles for the effective aggregation of risk data and risk reporting)
Target situation
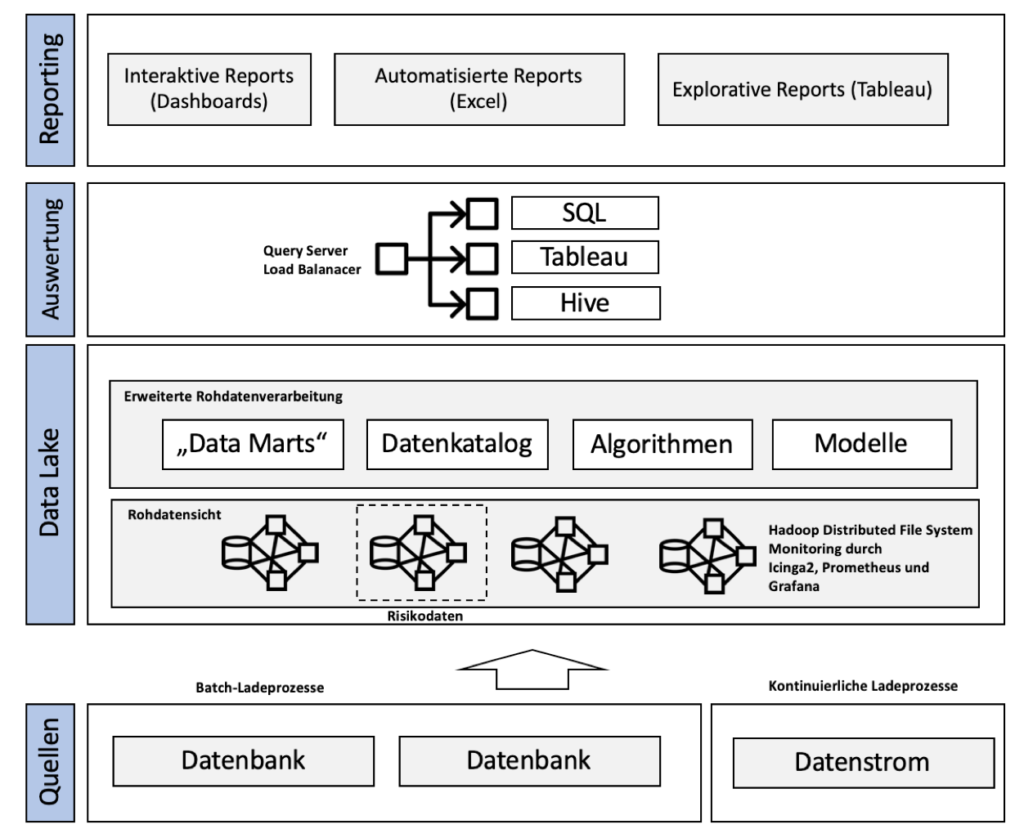
Now we have started to redesign the customer’s architecture. In the first step, we revised the charging processes. On the one hand, we loaded new data into our lake every day (at night) through batch loading processes. On the other hand, the data streams are loaded continuously, in contrast.

swell
All of this data is saved on hard drives and given a versioning stamp. This concept is called data lake and metadata management. When it comes to the data lake, we are talking about a very large data storage medium, i.e. an oversized hard drive that accepts data from a wide variety of sources in its raw format.
Data lake
The data lake helped us to carry out so-called data lineage. Think of it this way: Data lineage is like a patient record with important information about when data was created, the current data age and changes. The presentation is usually very clear in the form of a diagram.
Advantage: In reports we were able to prove exactly on which data basis we produced them at time X. With the help of data lineage, we were then able to track the change in the data.
Our data lake was based on Hadoop with modern monitoring by Prometheus, Grafana and Icinga 2. We have set up high-availability clusters for this purpose. The Hadoop Distributed File System (HDFS) is a distributed file system which, using a MapReduce algorithm, can split complex and computationally intensive tasks into many small individual parts on several computers. This means that evaluations based on the raw data are possible during runtime.
By the way: Due to the guidelines of MARISK and BCBS 239 for banks, we have loaded risk data into a separate cluster. This cluster could only be accessed by authorized persons. There are concerns that so many cross-circuits are drawn in the lake through the combination of data that we have saved certain data for security reasons.
Now we want to process the raw data from the brine as well. First we have the data from standardized reports that are used every week or requested by certain departments as Data marts copied to extra hard drives. This enabled us to guarantee access control and improve performance. We thus had fixed (permanent) and volatile data marts (project-based).
Limitation : I realize that data marts are a concept of the data warehouse, but in our context they were really helpful because we cannot rely 100% on the data lake.
With the help of new Algorithms (internal algorithms of the customer) we normalized the data at runtime or for the data marts. With the help of software, we also tried to gain new insights and knowledge by forming clusters using artificial intelligence Models to collect from the data. For example, we had data correlated or investigated departure. This has been done by a special AI service provider. Another element is the data catalog. Of the Data catalog is a catalog of metadata and shows the presentation rules for all data and the relationships between the various data.
Note: The data catalog has the important function that no relationship can be established between certain personal risk data without access to the catalog.
evaluation
Now we come to the logic of evaluation . We want to ensure that the various stakeholders in the company simply adhere to three standards Query server can send. The requests are sensibly distributed by a load balancer and also protected by an access control. The three standards are:
- SQL
- Hive (SQL-like Hadoop compatible language)
- Tableau (software tool)
Reporting
Now we come to the actual report generation for the end user. We have our three groups in the company for this purpose. These are:
- classic controlling,
- the specialist departments (and project managers) and
- the data scientists.
All three roles can send requests to our Query server send. There is a possible evaluation for each role:
- Fixed and automated reports for controlling,
- Interactive and customizable dashboards for the specialist departments and
- Exploratory reports in Tableau for the data scientists.
In summary, there are the standardized automatic reports, which we could view in CSV or Excel, as well as interactive dashboards for individual real-time reports using our own software. Furthermore, a team of data scientists had the goal of using Tableau to gain new knowledge from data (exploratory reports).
Summary of the new architecture :
- Raw data is loaded into the data storage (Hadoop cluster)
- Map-Reduce algorithm intelligently distributes the evaluation
- Evaluations are made directly from the raw data layer
- Transformation always only at runtime
- Data catalog for storing data relationships
- Modeling through AI
- Query Server allows various queries in various languages
- Data lineage for versioning the data
- Automated reports and interactive / exploratory dashboards through in-house development
Conclusion
Big data can significantly change companies and is right at the top of the agenda. The main obstacles, however, are the technical implementation and preparation of the data. Classical concepts are no longer capable of upgrading such data and companies are required to save data in a targeted manner and deliver up-to-date reports under pressure due to legal requirements.
In this case study, I have given an example of technical implementation that can serve as an impetus for practice. I built a data lake in the case study and used various well-known concepts such as Hadoop. My experience shows that the correct implementation of the concepts can help to make the potential of Big Data possible. It is important to draw meaningful reports and insights from the data.
Reading tip: Big data benefits
Image source: Business photo created by mindandi – www.freepik.com
[werbung] [fotolia]


